How is Kenya’s population distributed?
Introduction
In this analysis, I use Kenya’s 2019 census data to visualize the distribution of household sizes and population density in Python. The data is published at the Kenya National Bureau of Statistics’ website.
Data Extraction
The data is shared as a pdf report and we need apply data mining techniques in order to use it. After careful searching I settled for tika package to parse the document. Tika preserves the file structure when we parse it.
file_name = 'VOLUME 1 KPHC 2019.pdf'
raw = parser.from_file(file_name)
raw_content = raw['content']
# text sample
sample_index = np.random.randint(0,len(raw_content))
raw_content[sample_index:sample_index+1000]
From the pdf document, we can see that our target data are in tables 2.6 and 2.7. We can then use text idexing to find these tables as shown below
household_table_index = raw_content.find('Table 2.6:')
pop_density_table_index = raw_content.find('Table 2.7:')
last_index = raw_content.find("@KNBStats")-400
We know that the households table ends where population density table begins. Similarly the population table ends before the last index minus any extra text that is at the end of the document.
household_table_text = raw_content[
    household_table_index:pop_density_table_index].split('\n')
population_density_table_text = raw_content[
    pop_density_table_index:last_index].split('\n')
Once we have extracted the tables as text we can start cleaning them. Lucky for us the extracted data follow a similar structure and we can apply some tricks such as:
- dropping rows that contains header text such as Household, Population or Sq.km
- extracting integer values
- extracting string values
- removing spaces and punctuation marks
- replacing incorrectly spelled county/sub-county names
- replacing any outliers with the correct values
The resulting data is a pandas dataframe that we can merge with the counties shapefile.
Shapefiles
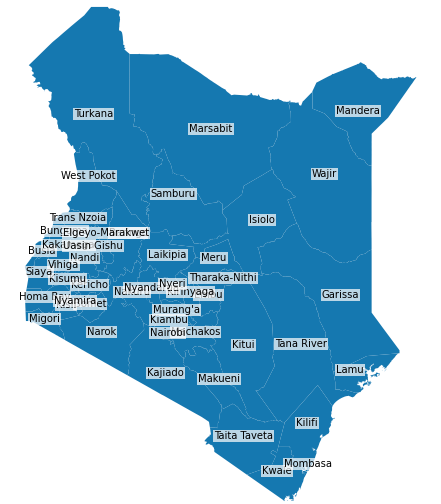
The shapefile that I found here is for Kenya’s sub-counties. Geopandas has a nice function that we use to combine sub-counties into counties.
sub_county_shapefile = gpd.read_file(
    '../sub-counties/ken_admbnda_adm2_iebc_20191031.shp')
# ADM1_EN is the county name column
counties_shapefile = sub_county_shapefile.dissolve('ADM1_EN')
As shown here, the resulting shapefile looks good and we can now go ahead and merge it with our data.
Data Analysis
1. Data overview
The first step of our analysis is to understand how the data is distributed. To do this, we use describe function in pandas to generate summary statistics. The table below shows count, mean, standard deviation, percentile, min, max, kurtosis and skewness values for our dataset.
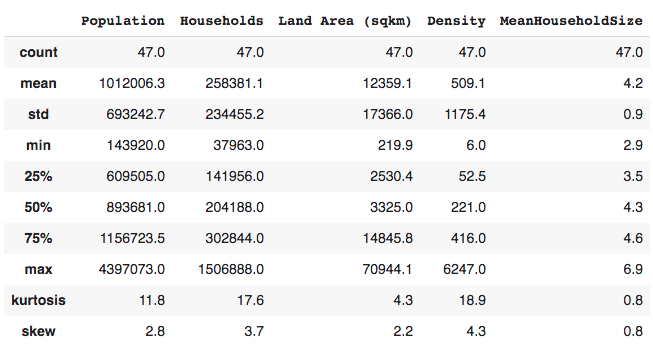
- the least populated county has 143920 people while the most populated county has 4397073 people
- there are fewer outliers in average household size than in population density
- the largest county (Marsabit) covers 12% of Kenya’s total land area (580,367 sqkm)
- the smallest county (Mombasa) covers 0.04% of Kenya’s total land area
2. Population
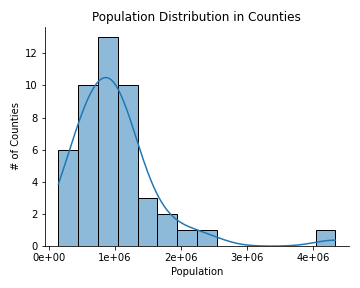
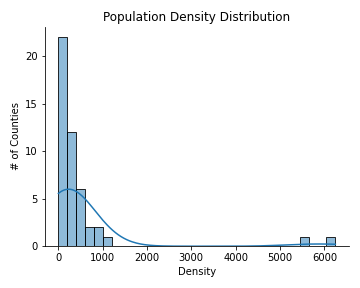
The graphs below show the population and population density distribution
- there is only one outlier (Nairobi) in the population sizes
- population density has two outliers (Mombasa & Nairobi)
- the total population data is highly skewed to the left. Most of the counties 1.5 million or less people
- all counties except Nairobi and Mombasa have 1000 or less people per square kilometer
 |
 |
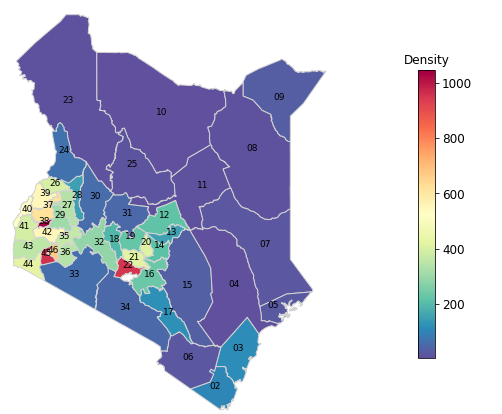
We can visualize this distribution on a map to get a better idea of how the population is distributed across Kenya. As shown in the population density map below:
- the northern and the eastern parts of Kenya are sparsely populated. Pastoralism is the main
economic activity in these regions. These counties include Mandera, Marsabit, Turkana,
Isiolo and Samburu - central and western parts of Kenya are densely populated
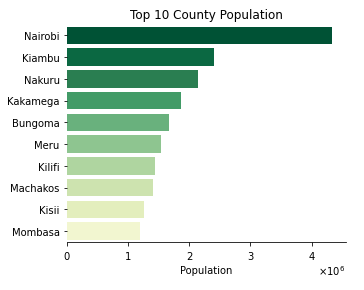
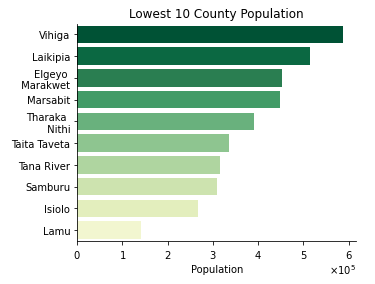
Here are counties with the highest and the lowest population sizes respectively.
 |
 |
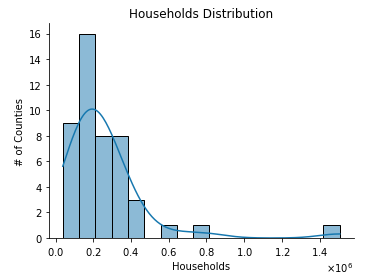
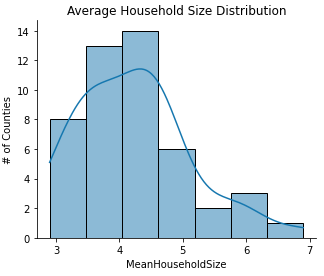
3. Households
Let’s look at the distribution of total households and household sizes across counties. Do counties with the highest population sizes have bigger household sizes on average?
From the data we can observe that:
- there is only one major outlier in the total number of households (Nairobi)
- the household sizes are skewed to the left with majority located around the mean
 |
 |
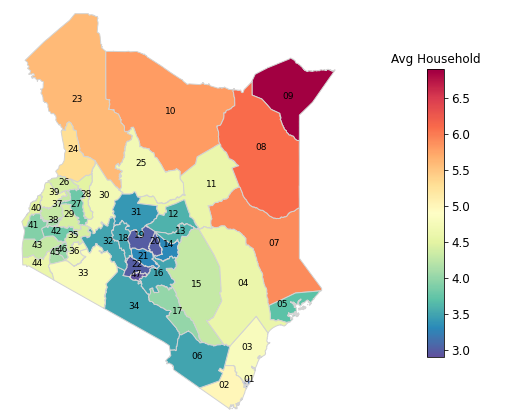
Below we can see that the average household size increase as you move from the central to the northern regions. Despite being sparsely populated, pastoralist counties have bigger households than counties in central and western regions. The central region have the lowest household sizes in the country.
4. Household Sizes & Population Density Interraction
We also look at the correlations between variables in our dataset. For instance is there any relationship between land area and population size? The table below shows correlation statistics for land area, population, population density, households and household size
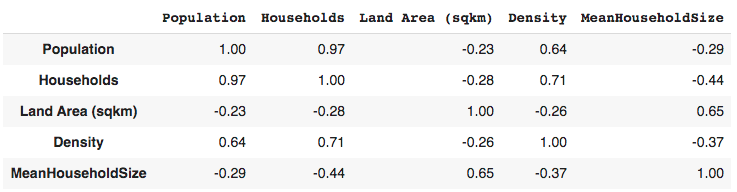
We observe that:
- there is a strong positive correlation between the total population and the number of households. This is expected since high population means more people living in that region
- household size have a negative relationship with the total number of households. High number of households are located in densely populated areas which are located in urban areas and historically urban areas have small households
- there is a positive correlation between land area and average household sizes. This can be explained by sparsely populated counties in the northern parts of Kenya that cover larger areas compared to the densely populated counties in central and western kenya
- population density and average household size have a negative relationship. This is influenced by the concentration of more people in the urban centers where in general household sizes are smaller.
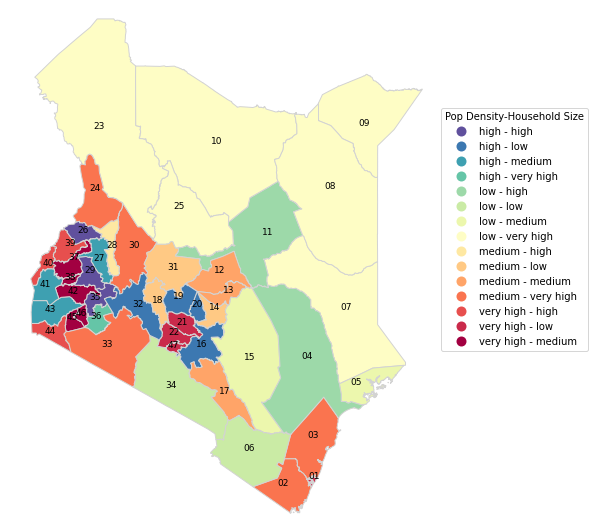
In the following map we classify population density and household sizes into groups. First we split population density and household sizes into four categories low, medium, high and very high. We then create qualitative pairs for all the counties. Northern counties have low population density and very high household sizes.
Central counties are further classified into smaller groups where high population density and low to medium household sizes are the most common combinations.