How has Covid-19 affected the movement of people in Kenya?
Introduction
Google has made a lot of datasets publicly available through the Google Public Datasets Program This makes it easy to get started with querying the data for analysis and visualization or integrating the datasets into applications. To understand the effect of Covid19 on mobility in Kenya, we use Covi-19 public datasets. The dataset can be downloaded from Google’s data warehouse, BigQuery which supports writing of standard or legacy SQL statements. We also need to create a project in google cloud in order to enable billing access. It is free to download 1 Terabyte of data per month.
Data Extraction
In the Google Cloud Platform (GCP) console, we select BigQuery and open SQL workspace to start writing our query statement. BigQuery tells us how much data is processed when the query is run as shown below

We further optimize the query to download only specific columns and combine the results with Covid19 infection updates.
Data Analysis
Once we’re satisfied with the query results, we start exploring the data using Data Studio. BigQuery connector exports all our query results to Data Studio. We can still edit the query in Data Studio.
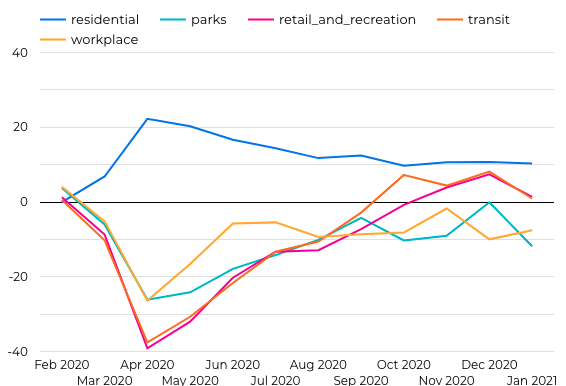
The following chart shows the percentage changes in mobility from their baseline levels in Kenya

Observations:
- Sharp increase in people in people staying at their homes between March and May
- Sharp decline in visits to parks, shopping centers, transit and workplace
- Increase in visits to parks, shopping centers between December and January
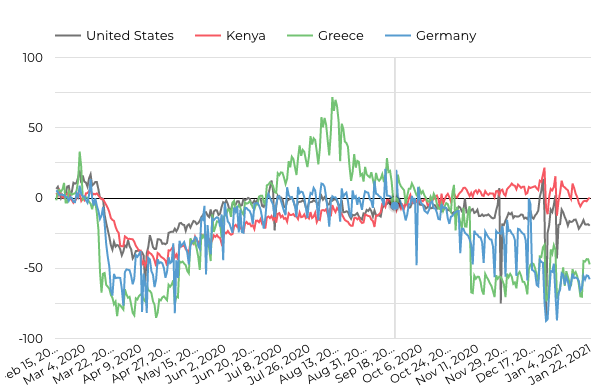
We can also compare the changes in mobility between countries.
In this analysis, we look at the differences in visits to retail and recreational centers in United States, Kenya, Greece and Germany.

Observations:
- The changes follow similar trends though Greece had a spike in the number of people visiting shopping centers in the summer.
- More Kenyans visited the shopping centers between Christmas and New Year’s compared to other countries
Conclusion
Covid-19 has impacted on movement routines for people in Kenya and across the world. Most people continued to work remotely since April 2020 while visits to shopping centers and parks remained lower. These changes will definitely continue to affect businesses as they see less traffic into their premises and hence the need to pivot to delivering orders to their customers.