Data Collection & Processing
Introduction
This an analysis on trends in rent prices across major towns in Kenya. The analysis will check if there is consistency in pricing. Is it possible that rates are higher in Mombasa and Nairobi but lower in other towns like Kilifi and Nakuru?
Web Page Analysis
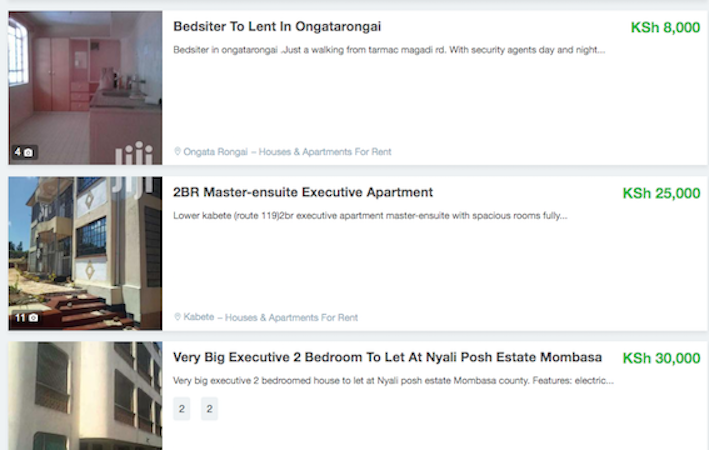
I scraped the data from the online classified ads platform jiji.co.ke which has a collections of items on sale such as electronics, cars, properties, jobs and services. Since we’re interested in apartments for rent we navigate to houses-apartments-for-rent where we can see all the listings. It’s possible to customize the link using location as a filter. From this page we can see that each ad has an image, title, description, location and price as shown below
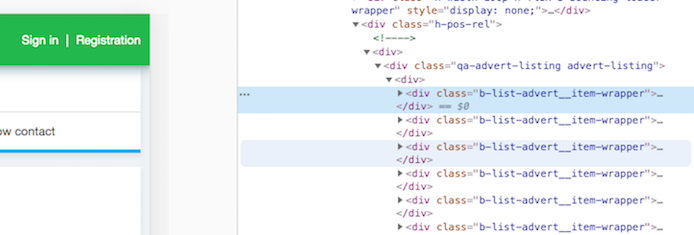
This gives us an idea of how to get the data. Inspecting the html page we can see how the html tags are laid out. Each advert is inside this div wrapper
as shown here
Data Processing Tools
I used Selenium and Beautiful Soup to scrape the data from the website. Both can be installed using pip. Installing a webdriver to automate your browser can be a bit tricky. You can read more about the installation process here and it should be the same version as your default browser. In my case, I used Chrome version 83.
I used pandas, numpy,matplotlib and seaborn for data processing and visualization.
Once we have all the packages installed, we can load them to the working environment.
Data Collection & Processing
Once all the packages are loaded, we can create an instance of the web browser and use it to open the properties adress url. I customized the browser for each town to make downloading the data easier. I then used BeautifulSoup to extract data from the loaded webpage. With the BeautifulSoup instance of the page, we can start extracting data inside the div tags. I was able to extract url_ids, locations,prices,titles and decriptions for the ads. The following example shows how to get a list of prices from a div tag
Then we create a dataframe using the downloaded data
The resulting dataframe will look like this:

The next step is to clean up the data. First we extract the number of bedrooms from the listings’ titles and descriptions then we remove the currency notation from the prices and convert them into integer values.
I found the nifty trick below useful in generating the number of bedrooms from the title column: create a list of bedrooms, convert it to dataframe and then concatenate it back to the main dataframe.
This combined with text search made it possible to generate bedrooms for ~ 80% of the listings. Some listings had spelling errors and needed to be coded manually.